| Indicator description |
The indicator presents inequality in the distribution of income or consumption among individuals or households, expressed by the Gini index. The Gini index is a measure of distributional inequality, where a value of 0 represents perfect equality and a value of 100 represents perfect inequality. |
|---|---|
| Data source and methodology |
The indicator provides information on the level and evolution of inequality in the distribution of income or consumption in Bosnia and Herzegovina. Monitoring the indicator enables changes in inequality to be tracked over time and contributes to monitoring progress in reducing inequality. |
| Coverage and comparability |
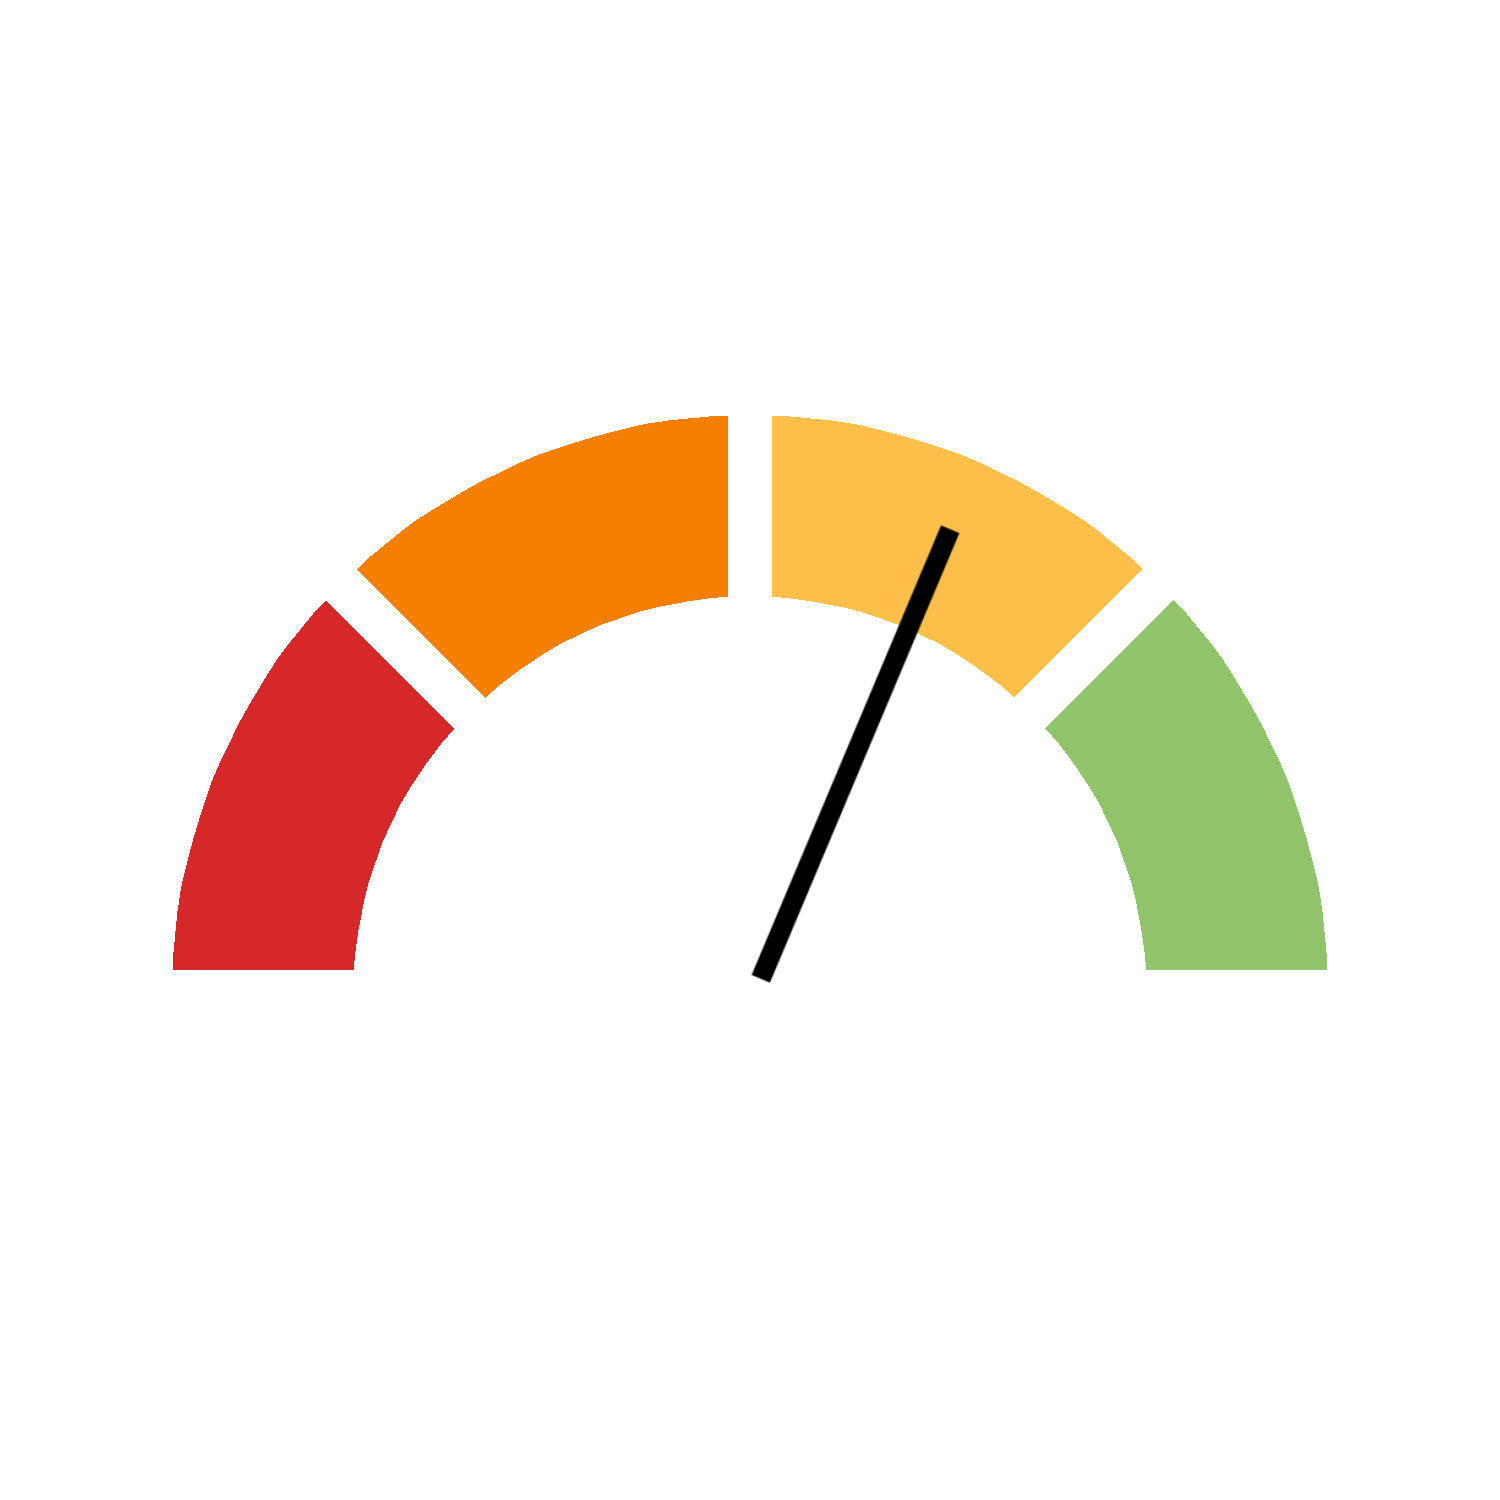
For monitoring Goal 10 in Bosnia and Herzegovina, a proxy indicator is used that represents the Gini index as a measure of inequality in the distribution of income or consumption. The data presented for this indicator are taken from the World Bank’s World Development Indicators database and represent World Bank estimates. According to the World Bank’s methodological information, the data are based on primary data from nationally representative household surveys obtained by the World Bank from government statistical agencies and World Bank country departments. The Gini index is negatively oriented with respect to the desired direction of change, meaning that a decrease in its value represents favourable movement, while an increase represents unfavourable movement. The automatic progress status is calculated based on the direction and rate of change in the indicator value over the available time series, using the automatic progress calculation methodology of the Open SDG platform. The negative direction (direction: negative) is used for the progress assessment, so that a decrease in the Gini index represents movement in the favourable direction. The displayed status “Moderate progress” represents the result of the automatic calculation based on the available data and the defined progress assessment approach. As this is a proxy indicator, the progress assessment relates to the aspect of inequality measured by the Gini index and does not represent a direct assessment of all dimensions of the original indicator. |
| National context and objectives |
No specific national target has been established for this proxy indicator in Bosnia and Herzegovina. The indicator is monitored through changes in the Gini index over time, with a decrease in the value indicating a reduction in inequality in the distribution of income or consumption. |
Progress status
Moderate progress
Download headline data (.csv)
Download source data (.csv)
Download source data for disaggregations (.csv)
Headline data
| Year | Value | UNIT_MEASURE | SERIES |
|---|---|---|---|
| 2004 | 34.0 | Percent | Gini index - proxy indicator |
| 2007 | 34.3 | Percent | Gini index - proxy indicator |
| 2011 | 33.3 | Percent | Gini index - proxy indicator |
| 2015 | 32.9 | Percent | Gini index - proxy indicator |
| 2021 | 30.3 | Percent | Gini index - proxy indicator |
Source 1
| Organisation |
World Bank, Development Research Group |
|---|---|
| Link to data source | Link opens in a new window |