
| Indicator description |
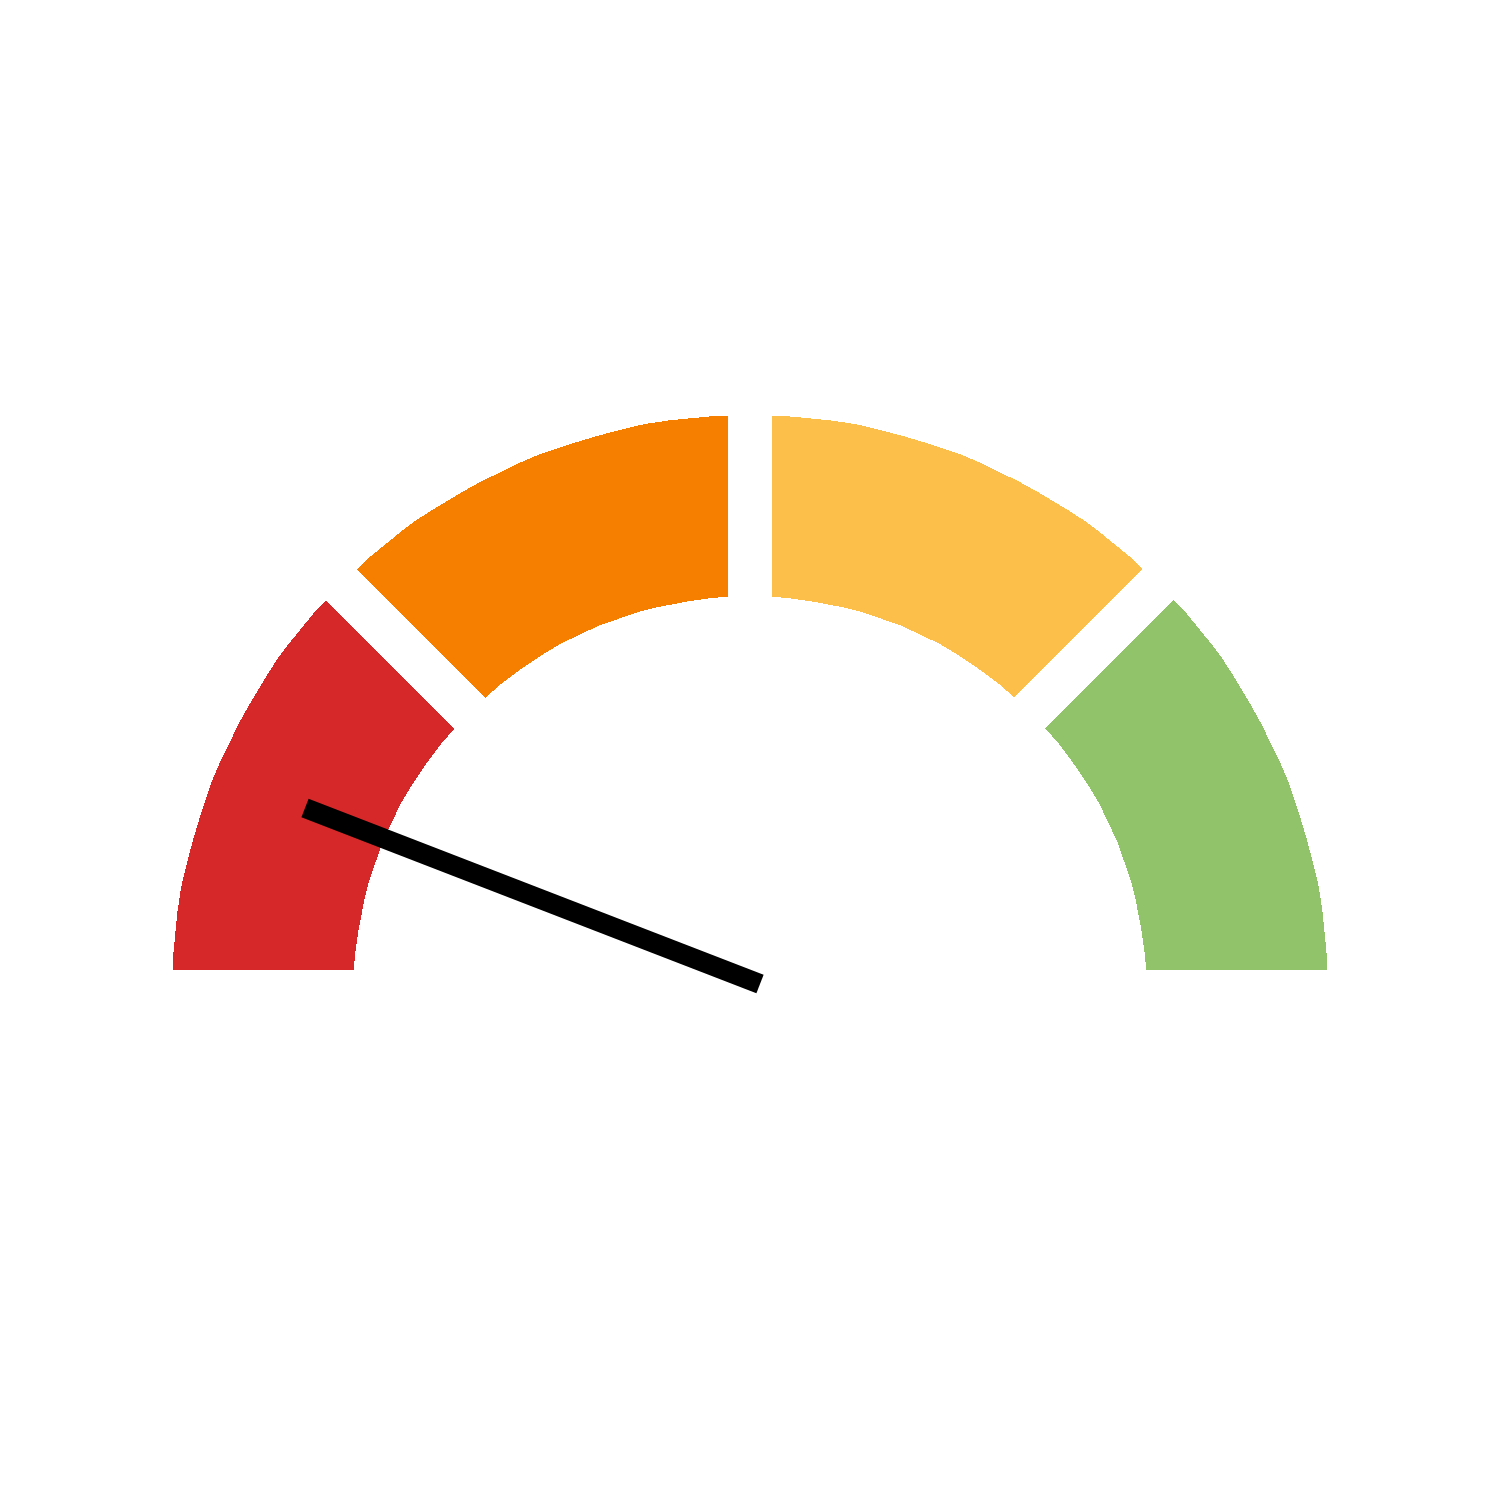
For Bosnia and Herzegovina, the Corruption Perceptions Index (CPI), published by Transparency International, is presented. The index assesses perceptions of corruption in the public sector on a scale from 0 to 100. A score of 0 indicates a very high level of perceived corruption, while a score of 100 indicates a very low level of perceived corruption in the public sector. |
|---|---|
| Data source and methodology |
The indicator enables monitoring of changes in perceptions of public-sector corruption in Bosnia and Herzegovina. Corruption can undermine trust in institutions, reduce the effectiveness of public administration and adversely affect investment and economic development. The indicator contributes to monitoring Sustainable Development Goal 16, which concerns peace, justice and strong institutions. |
| Coverage and comparability |
The CPI is a composite index based on surveys and expert assessments from multiple sources. For a country to be included in the ranking, it must be covered by at least three CPI data sources. Scores are expressed on a scale from 0 to 100, with a higher score indicating a more favourable perception of the state of the public sector. Data for Bosnia and Herzegovina are taken from Transparency International publications. |
| National context and objectives |
No specific numerical target has been established for Bosnia and Herzegovina for this indicator under the methodology used for monitoring. |
Download source data for disaggregations (.csv)
Headline data
| Year | Value | UNIT_MEASURE | SERIES |
|---|---|---|---|
| 2016 | 39 | Score | Corruption Perceptions Index |
| 2017 | 38 | Score | Corruption Perceptions Index |
| 2018 | 38 | Score | Corruption Perceptions Index |
| 2019 | 36 | Score | Corruption Perceptions Index |
| 2020 | 35 | Score | Corruption Perceptions Index |
| 2021 | 35 | Score | Corruption Perceptions Index |
| 2022 | 34 | Score | Corruption Perceptions Index |
| 2023 | 35 | Score | Corruption Perceptions Index |
| 2024 | 33 | Score | Corruption Perceptions Index |
| 2025 | 34 | Score | Corruption Perceptions Index |
| Indicator description |
The Corruption Perceptions Index (CPI) is a composite index based on a combination of surveys and expert assessments from different sources. It ranks countries according to the perceived level of corruption in the public sector. A score of 0 indicates a very high level of perceived corruption, while a score of 100 indicates a perception of a very clean public sector. The index is published by Transparency International. |
|---|---|
| Data source and methodology |
The indicator is used to monitor progress towards Sustainable Development Goal 16, which concerns peace, justice and strong institutions. It is linked to European Commission priorities relating to security, the protection of democracy and the upholding of European values. Corruption can reduce investment, undermine the fair functioning of the internal market and diminish public revenues. It can also facilitate organised crime and other serious criminal offences. The CPI is thematically related to global indicator 16.5.2, but it does not directly measure businesses’ experiences of bribery. |
| Coverage and comparability |
The index includes sources that measure perceptions of corruption in the public sector and allow comparisons between countries and territories. To be included in the ranking, a country must be covered by at least three CPI data sources. The unit of measurement is a score on a scale from 0 to 100. The index is published by Transparency International and used by Eurostat to monitor Sustainable Development Goal 16. |
| EU context and objectives |
The long-term objective for this indicator is a value of 88. |
Source 1
| Organisation |
Transparency International |
|---|---|
| Link to data source | Link opens in a new window |
Source 2
| Organisation |
Eurostat |
|---|---|
| Link to data source | Link opens in a new window |