| Indicator description |
The indicator measures total ammonia (NH₃) emissions resulting from agricultural production in Bosnia and Herzegovina. These emissions arise from manure management, the application of inorganic nitrogen fertilisers and the spreading of manure on land, as well as the excretion of urine and faeces by grazing animals. Ammonia contributes to air pollution, acidification and eutrophication. Reducing ammonia emissions is an important aspect of more sustainable agricultural production and more efficient nitrogen management. |
|---|---|
| Data source and methodology |
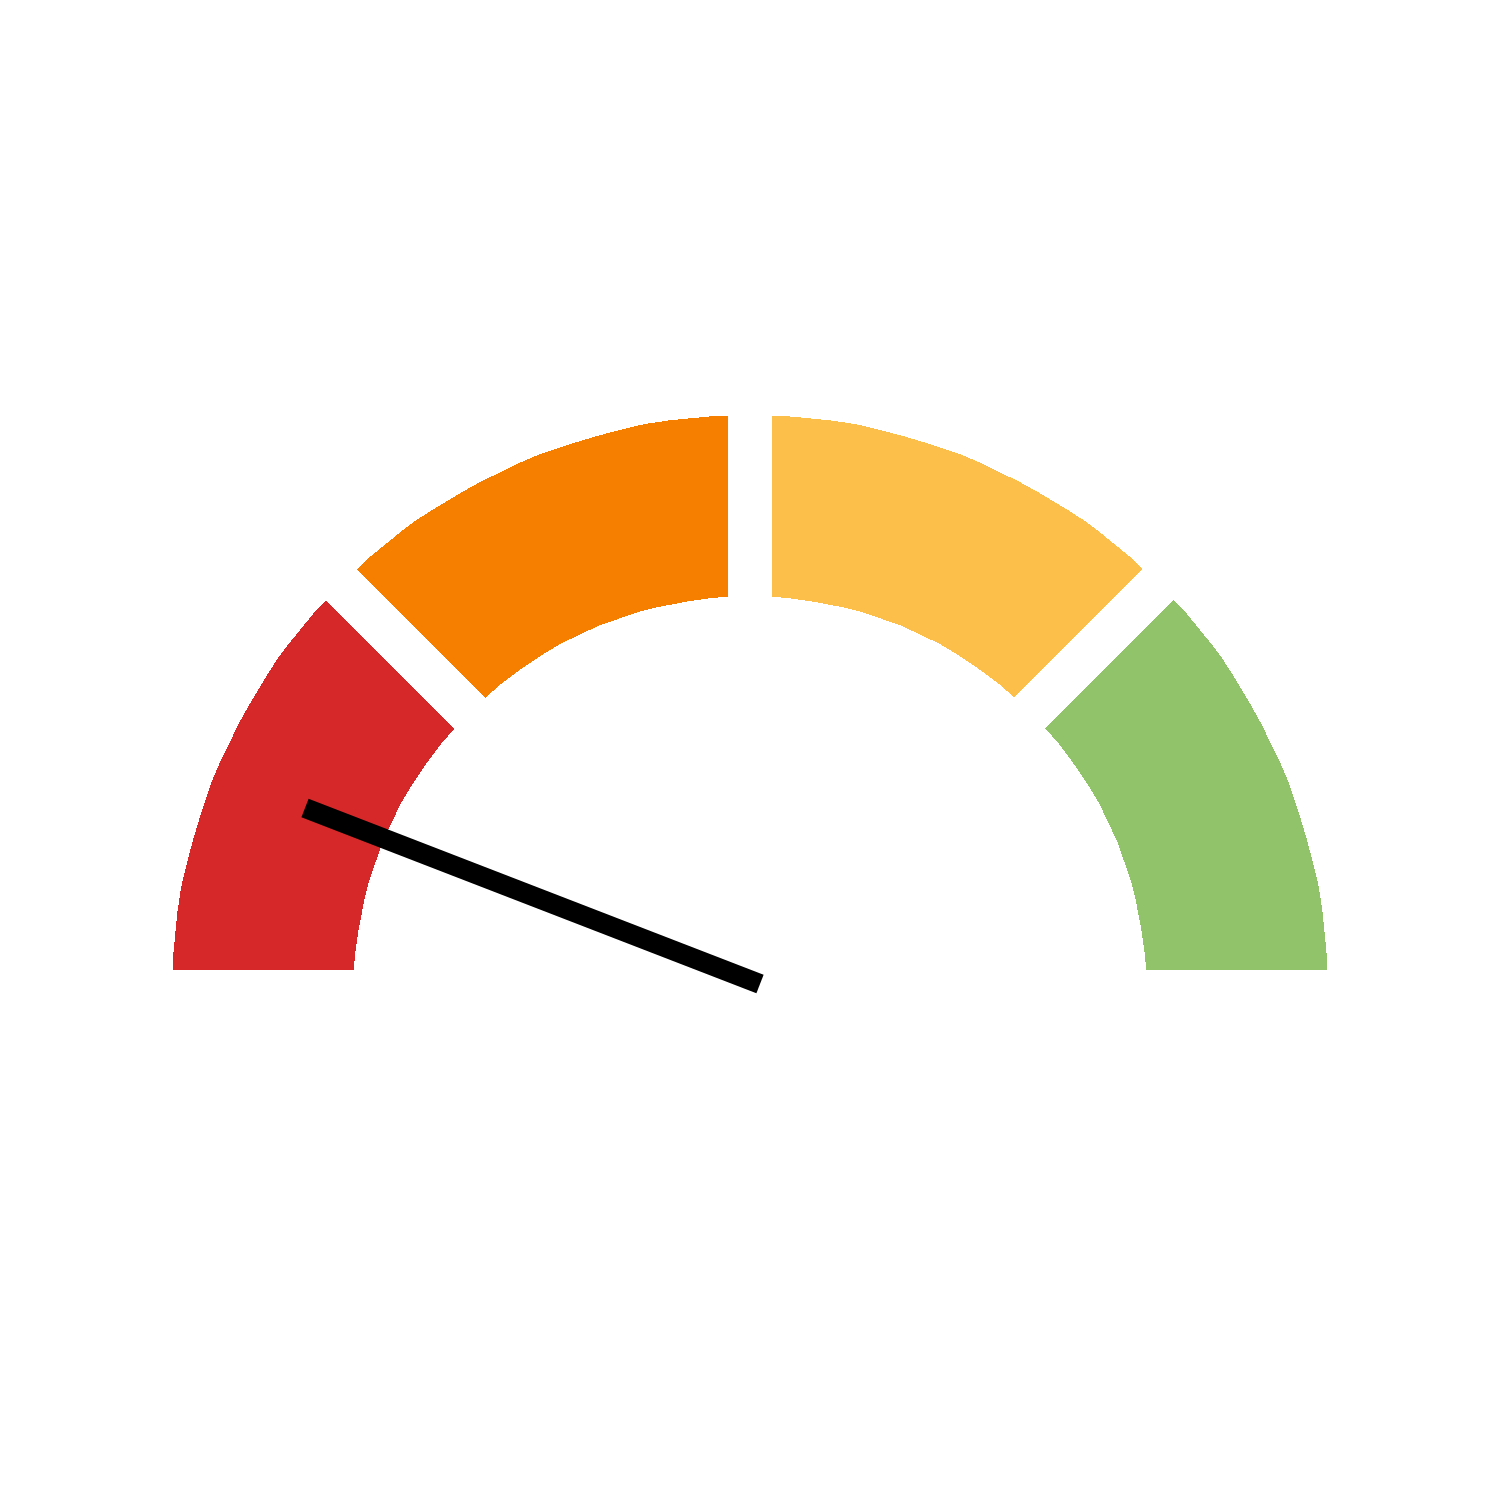
The data source is the European Environment Agency (EEA), within the framework of reporting under the Convention on Long-range Transboundary Air Pollution (CLRTAP). The data refer to total ammonia emissions from agricultural production and are expressed in tonnes. The supplied time series covers the period from 2011 to 2022. Progress is calculated automatically in the Open SDG system using the compound annual growth rate (CAGR), with 2015 as the base year and 2030 as the default target year, since no alternative years or quantitative target have been specified. The desired direction is a reduction in emissions. Emissions increased from 20,544 in 2015 to 24,047 in 2022, representing an average annual increase of approximately 2.3%. According to the automatic calculation, this trend indicates deterioration. This status describes the trend in total emissions over the period observed and does not assess achievement against a specific national target level. |
| Coverage and comparability |
The time series covers total agricultural ammonia emissions in Bosnia and Herzegovina for the period 2011–2022. The increase in values indicates a rise in total emissions over the period observed. The supplied series reports emissions in tonnes and does not show emissions per hectare of utilised agricultural area. |
| National context and objectives |
Reducing ammonia emissions helps to reduce air pollution and its adverse effects on soil and water. Progress can be supported by improving manure management, applying nitrogen fertilisers more efficiently and reducing nitrogen losses from agricultural production. No specific numerical national target has been established for this total-emissions series in Bosnia and Herzegovina. The automatically calculated progress status is based on the data trend and does not represent an assessment of achievement against a specific national target. |
Download source data for disaggregations (.csv)
Headline data
| Year | Value | UNIT_MEASURE | SERIES |
|---|---|---|---|
| 2011 | 17.564 | OOOt | Ammonia emissions from agriculture |
| 2012 | 18.309 | OOOt | Ammonia emissions from agriculture |
| 2013 | 19.054 | OOOt | Ammonia emissions from agriculture |
| 2014 | 19.799 | OOOt | Ammonia emissions from agriculture |
| 2015 | 20.544 | OOOt | Ammonia emissions from agriculture |
| 2016 | 21.128 | OOOt | Ammonia emissions from agriculture |
| 2017 | 21.712 | OOOt | Ammonia emissions from agriculture |
| 2018 | 22.295 | OOOt | Ammonia emissions from agriculture |
| 2019 | 22.879 | OOOt | Ammonia emissions from agriculture |
| 2020 | 23.463 | OOOt | Ammonia emissions from agriculture |
| 2021 | 23.463 | OOOt | Ammonia emissions from agriculture |
| 2022 | 24.047 | OOOt | Ammonia emissions from agriculture |
| Indicator description |
The indicator measures ammonia (NH₃) emissions resulting from agricultural production. These emissions arise from manure management, the application of inorganic nitrogen fertilisers and the spreading of manure on land, as well as the excretion of urine and faeces by grazing animals. Ammonia is an important air pollutant, and agriculture is the dominant source of its emissions. The indicator tracks total ammonia emissions and emissions per hectare of utilised agricultural area (UAA). The definition is based on Common Agricultural Policy (CAP) indicator C45, “Emissions from agriculture”. |
|---|---|
| Data source and methodology |
The data source is the European Environment Agency (EEA), which compiles air pollutant emission inventories under the Convention on Long-range Transboundary Air Pollution (CLRTAP). The data are aligned with the national emission inventories submitted by EU Member States. Data on utilised agricultural area are obtained from Eurostat’s annual crop statistics. The indicator is published annually. |
| Coverage and comparability |
The indicator covers ammonia emissions from agricultural production, including emissions associated with manure management, the application of nitrogen fertilisers and manure to land, and the excretion of grazing animals. Data are expressed as total emissions and as emissions per hectare of utilised agricultural area. For international comparisons of emission intensity, the per-hectare value is used, relating total emissions to the UAA for the corresponding year. Comparisons between national data and EU data require consistent units of measurement and a comparable methodological scope. |
| EU context and objectives |
Reducing ammonia emissions helps to reduce air pollution and its adverse effects on ecosystems and human health. Measures under the Common Agricultural Policy and the National Emission Reduction Commitments Directive (NEC Directive) contribute to reducing emissions and improving agricultural practices. A long-term reference value of 8 kg of ammonia emissions per hectare of utilised agricultural area is used in European sustainable development comparisons. It should be interpreted as a reference value rather than a universally binding target for every country. |
Source 1
| Organisation |
EEA (CLRTAP) |
|---|---|
| Link to data source | Link opens in a new window |